

Hello,
I need four responses of at least 200 words each for the below students discussions for this week. Also in the bold below are the questions the students at answering.
Instructions:
When using a control chart, what are some patterns that would indicate that the process is out of control? Additionally explain what might cause a process to be out of control. In your responses to other students, relate and identify to an example of process that you have seen out of control.
Student one:
Control charts are running records of the performance of the process, and they contain a vast store of information on potential improvements (Quality America, n.d.). On a control chart, data is mapped according to the order of time. After recording the data, the charts allow for data to be quickly compared with previous data. This is where patterns are established and observed. By viewing the charts, this form of control can find any problems or variations and correct it. To be considered “out of control”, the process variation is unpredictable. There are special cause patterns that when seen are considered out of control. Some of those patterns are: freaks and drifts, just to name a few. Freaks result from causes that have a large effect but that occur infrequently (Quality America, n.d.). Drifts are generally seen in the processes where the current process value is partly determined by the previous process state(Quality America, n.d.).
An example of what might cause a process to be out of control is the following example: The probability of rolling a 7 with a pair of dice is 6 in 36 or 17%. Now, the probability of rolling a number 7 again (twice in a row) is 2.8%. Finally, the probability of rolling a 7 three times in a row is .46%. So if you see someone do that, the probability is small enough that you can safely conclude that something is out of the ordinary. This is the same thinking for control charts (Gygi, Williams, DeCarlo and Covey, n.d.).
References
Gygi, Craig, Williams, Bruce, DeCarlo, Neil, & Covey, Stephen. (n.d.). How To Detect Patterns in Control Charts for Six Sigma. Dummies. Retrieved from: https://dummies.com/careers/project-management/six…
n.a., (n.d.). Control Chart Interpretation. Quality America Inc. Retrieved from: https://qualityamerica.com/LSS-Knowledge-Center/st…
Student two:
Control charts are useful because they can help to find errors and quality issues for experiments. Stable control charts allow us to begin evaluating and making improvements. There are, however, a few different things that will show us that a control chart in not stable, rather, it is out of control. One of the things that can be observed is called a run. A run is where eight points on a control chart that are either above or below the center line. These would be continuous points. Another pattern that can show us that a process is out of control is called a trend. This is an “unusually long series of consecutive increases or decreases in the dataâ€. (Harrison, 20112) It should be at least six or seven consecutive points.
There are zones a, b, and c within a control chart. Zone c is closest to the control line, then zone b followed by zone a as the furthest away. Each zone should have certain amounts of points in them. At times, all points will be within zone c. This can happen because an operator may see a result above the desired value and then make adjustments to lower the value. From there, the results will be below the value and the operator will make adjustments to raise the value. We will often see a saw tooth pattern resulting from this action.
Sean
Resources:
Control Chart Rules and Interpretation. (2016, March 30). Retrieved from https://www.spcforexcel.com/knowledge/control-chart-basics/control-chart-rules-interpretation.
Harrison, S. (2012). Retrieved from https://www.sheffieldmca.org.uk/UserFiles/File/Har…
Queuing Theory Models and Quality Control. (n.d.). Retrieved December 4, 2019, from https://apus.realizeithome.com/.
Student three:
Production process can make or break a company. When production is running on time or even a head of schedule, it is beneficial to the company. However, when production is delayed or even stopped, the ramifications for the company can be astronomical. The challenge comes in being able to develop a tracking mechanism. This is where control charts come into play. A control chart is a tool that looks at data compiled over time. Each data segment is collected by averaging a small batch. By using data points collected over a period of time, a control chart is developed. Analyzing the data points will reveal an average, aka the normal, small outliers – high and low- that reveal natural variances and finally the high and low points that significantly differ from the mean. The data points will not line up in a perfect line. The small outliers will determine the upper and lower limits to the chart. Knowing the high and low limits is called the X Chart. The points that lay higher / lower than the limits are the points would indicate to the managers that something significant impacted production and therefore should be investigated.
The X chart focuses on the average of the data. However, as me those who are familiar with charts will know, charts are only as reliable as the data. I mentioned above that small batches are averaged to create the data points to create the X Chart. However, it is possible that the small set could have been skewed and therefore the data point is not accurate. To mitigate the margin of error, managers must also consider the range of the data, also known as the R chart. By looking at the data provided by both the X Chart and the R Chart, the managers will be able to see an accurate picture of their production process.
References
Render, B., Stair, R. M., Hanna, M. E., & Hale, T. S. (2015). Quantitative Analysis for Management(12th ed.). Boston, MA: Pearson. pages: 539-549
Student four:
The control chart is a graph used to study how a process changes over time. Data are plotted in time order. A control chart always has a central line for the average, an upper line for the upper control limit, and a lower line for the lower control limit. These lines are determined from historical data. By comparing current data to these lines, you can draw conclusions about whether the process variation is consistent (in control) or is unpredictable (out of control, affected by special causes of variation). This versatile data collection and analysis tool can be used by a variety of industries and is considered one of the seven basic quality tools.
Out-of-control signals
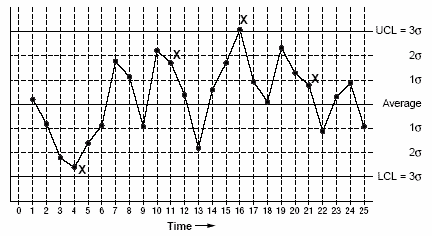
Figure 1 Control Chart: Out-of-Control Signals
- A single point outside the control limits. In Figure 1, point sixteen is above the UCL (upper control limit).
- Two out of three successive points are on the same side of the center line and farther than 2 σ from it. In Figure 1, point 4 sends that signal.
- Four out of five successive points are on the same side of the center line and farther than 1 σ from it. In Figure 1, point 11 sends that signal.
- A run of eight in a row are on the same side of the center line. Or 10 out of 11, 12 out of 14, or 16 out of 20. In Figure 1, point 21 is eighth in a row above the center line.
- Obvious consistent or persistent patterns that suggest something unusual about your data and your process.
Actually, an out of control process indicates the presence of non-random variation. Non-random variation is caused by definite, specific causes that are called assignable causes. These assignable causes make the process go out of control or become statistically unstable. A process that is out of control is affected by special causes in addition to the common causes affecting the mean and/or variance.


 Jermaine Byrant
 Nicole Johnson


