

One of the shortcomings of the MPI presented at the website of MSU-CIBER is that it is not product specific. A company might for instance want to identify the potential of markets across the world in regards to their product. Your textbook gives an example of such a case and how the MPI can be constructed. In the following example, a more general example is given with explicit steps on how to construct such an index and its advantages/disadvantages in assessing markets for firm entry. Your assignment is to replicate the MPI 2009 worksheet for any other year in the period 2004-2008. For this particular research task, your report should be a Word or PDF document that has the final MPI table (e.g., Step 4 table in the excel file below). Make sure that you sort the final MPI table by Overall Ranking. You may find it easier to report the top 10 countries in your first page along with a short paragraph describing your findings and copy/paste the full table in the following pages of your document.
Step 1:
The first step in constructing such an index is to select the variables that measure the various markets’ potential and the sample of countries that you want to include.
In regards to the sample of countries, the more countries we include in the analysis the more representative the sample is and the more options to choose from. Therefore, a sample with more countries is preferred even if we want to focus on emerging markets since we can always isolate the emerging markets after the analysis is performed.
In regards to variables that measure the various markets’ potential, it sometimes is product-specific (e.g., a pharmaceutical company might want to include some different measures in the calculation of MPI than a retail company) but most of the measures will be the same, especially the institutional measures (economic and political freedom, country risk rating). In this example, we have selected the following variables for the year 2009:
| Dimension | Weight | Measures Used |
|---|---|---|
| Market Size | 6/25 |
|
| Market Growth Rate | 4/25 |
|
| Market Intensity | 3/25 |
|
| Commercial Infrastructure / Access to Consumer | 3/25 |
|
| Market Receptivity | 3/25 |
|
| Free Market Structure | 3/25 |
|
| Country Risk | 3/25 |
|
1 Source: World Bank, World Development Indicators
2 Source: U.S. Census Bureau Foreign Trade Division, Country Trade Data – 2009
3 Source: Heritage Foundation, The Index of Economic Freedom – 2009
4 Source: Freedom House, Survey of Freedom in the World – 2009
5 Source: Euromoney, Country Risk Survey – March 2011 (earlier data were not freely available)
Step 2:
After the collection of the data, each measure needs to be standardized in order to be comparable with the rest of the measures. A common formula is called the Z score and is calculated in the following way:
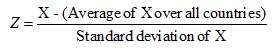
Where X denotes a particular measure (e.g., urban population) and its values represent the value for each country in the sample.
Step 3:
After each measure has been standardized, we find the average of all standardized measures within each dimension for each country. That is, for dimension Market Size, its first value will be the average of the standardized urban population and standardized electricity production for country A. Therefore, after this step we have a column of data for each of the seven dimensions of the MPI index.
Step 4:
The resulting scores need to be converted to a scale of 1-100 and for this we use the following formula:
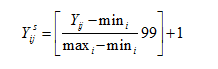
Where Yijs is the scaled final value of country j for the dimension i (i=1,.., 7 ); Yij is the average score of country j on dimension i; mini and maxi are the minimum and maximum values for dimension i, respectively. Finally, we find the weighted average of all dimensions using the weights presented in the previous table (based on input from managers).
Now if all the above sounds really confusing, the following Excel file demonstrates the steps in the construction of the Market Potential Index. In the worksheet “Raw Data” you will find the data that are used in the construction of the MPI for the years 2004 to 2009. In the worksheet “MPI 2009” the steps required for the construction of the MPI are demonstrated (see formulas in the first row cells of each table).
What are some potential advantages and disadvantages of the index?
Advantages
- It’s construction is straightforward and it requires only freely available data.
- It provides an initial screening for attractiveness of the foreign market and can be easily modified to account for product-specific factors using different variables from the World Development Indicators or other sources.
Disadvantages
- Looking at the 2009 MPI, Luxembourg is in the third position owing to ratings in all dimensions of the index apart from Market Size. However, market size is an important determinant in assessing entry. Therefore, while the overall index helps us to split good vs. bad choices, we also need to look at the individual components of the index.
- It cannot predict potential future economic or financial distress of the foreign market, especially if it is calculated for a particular year. For instance, Ireland is in the 21st place but it recently received a bailout from IMF. Therefore, for more complete picture several years of observation are needed but more importantly measures that more accurately capture deterioration of the economy and financial situation of each country are needed. We will cover these in more detail in later chapters.
What if we don’t have any input from managers to calculate Weights?
If we don’t have any information about appropriate weights to use in the calculation of MPI, then we can follow the textbook’s paradigm and find the average MPI. In other words, in step 4 of the above example, instead of weighted average we calculate the ordinary average.One of the shortcomings of the MPI presented at the website of MSU-CIBER is that it is not product specific. A company might for instance want to identify the potential of markets across the world in regards to their product. Your textbook gives an example of such a case and how the MPI can be constructed. In the following example, a more general example is given with explicit steps on how to construct such an index and its advantages/disadvantages in assessing markets for firm entry. Your assignment is to replicate the MPI 2009 worksheet for any other year in the period 2004-2008. For this particular research task, your report should be a Word or PDF document that has the final MPI table (e.g., Step 4 table in the excel file below). Make sure that you sort the final MPI table by Overall Ranking. You may find it easier to report the top 10 countries in your first page along with a short paragraph describing your findings and copy/paste the full table in the following pages of your document.
Step 1:
The first step in constructing such an index is to select the variables that measure the various markets’ potential and the sample of countries that you want to include.
In regards to the sample of countries, the more countries we include in the analysis the more representative the sample is and the more options to choose from. Therefore, a sample with more countries is preferred even if we want to focus on emerging markets since we can always isolate the emerging markets after the analysis is performed.
In regards to variables that measure the various markets’ potential, it sometimes is product-specific (e.g., a pharmaceutical company might want to include some different measures in the calculation of MPI than a retail company) but most of the measures will be the same, especially the institutional measures (economic and political freedom, country risk rating). In this example, we have selected the following variables for the year 2009:
| Dimension | Weight | Measures Used |
|---|---|---|
| Market Size | 6/25 |
|
| Market Growth Rate | 4/25 |
|
| Market Intensity | 3/25 |
|
| Commercial Infrastructure / Access to Consumer | 3/25 |
|
| Market Receptivity | 3/25 |
|
| Free Market Structure | 3/25 |
|
| Country Risk | 3/25 |
|
1 Source: World Bank, World Development Indicators
2 Source: U.S. Census Bureau Foreign Trade Division, Country Trade Data – 2009
3 Source: Heritage Foundation, The Index of Economic Freedom – 2009
4 Source: Freedom House, Survey of Freedom in the World – 2009
5 Source: Euromoney, Country Risk Survey – March 2011 (earlier data were not freely available)
Step 2:
After the collection of the data, each measure needs to be standardized in order to be comparable with the rest of the measures. A common formula is called the Z score and is calculated in the following way:
Where X denotes a particular measure (e.g., urban population) and its values represent the value for each country in the sample.
Step 3:
After each measure has been standardized, we find the average of all standardized measures within each dimension for each country. That is, for dimension Market Size, its first value will be the average of the standardized urban population and standardized electricity production for country A. Therefore, after this step we have a column of data for each of the seven dimensions of the MPI index.
Step 4:
The resulting scores need to be converted to a scale of 1-100 and for this we use the following formula:
Where Yijs is the scaled final value of country j for the dimension i (i=1,.., 7 ); Yij is the average score of country j on dimension i; mini and maxi are the minimum and maximum values for dimension i, respectively. Finally, we find the weighted average of all dimensions using the weights presented in the previous table (based on input from managers).
Now if all the above sounds really confusing, the following Excel file demonstrates the steps in the construction of the Market Potential Index. In the worksheet “Raw Data” you will find the data that are used in the construction of the MPI for the years 2004 to 2009. In the worksheet “MPI 2009” the steps required for the construction of the MPI are demonstrated (see formulas in the first row cells of each table).
What are some potential advantages and disadvantages of the index?
Advantages
- It’s construction is straightforward and it requires only freely available data.
- It provides an initial screening for attractiveness of the foreign market and can be easily modified to account for product-specific factors using different variables from the World Development Indicators or other sources.
Disadvantages
- Looking at the 2009 MPI, Luxembourg is in the third position owing to ratings in all dimensions of the index apart from Market Size. However, market size is an important determinant in assessing entry. Therefore, while the overall index helps us to split good vs. bad choices, we also need to look at the individual components of the index.
- It cannot predict potential future economic or financial distress of the foreign market, especially if it is calculated for a particular year. For instance, Ireland is in the 21st place but it recently received a bailout from IMF. Therefore, for more complete picture several years of observation are needed but more importantly measures that more accurately capture deterioration of the economy and financial situation of each country are needed. We will cover these in more detail in later chapters.
What if we don’t have any input from managers to calculate Weights?
If we don’t have any information about appropriate weights to use in the calculation of MPI, then we can follow the textbook’s paradigm and find the average MPI. In other words, in step 4 of the above example, instead of weighted average we calculate the ordinary average.


 Jermaine Byrant
 Nicole Johnson


